beginner-guides
Build your first chart
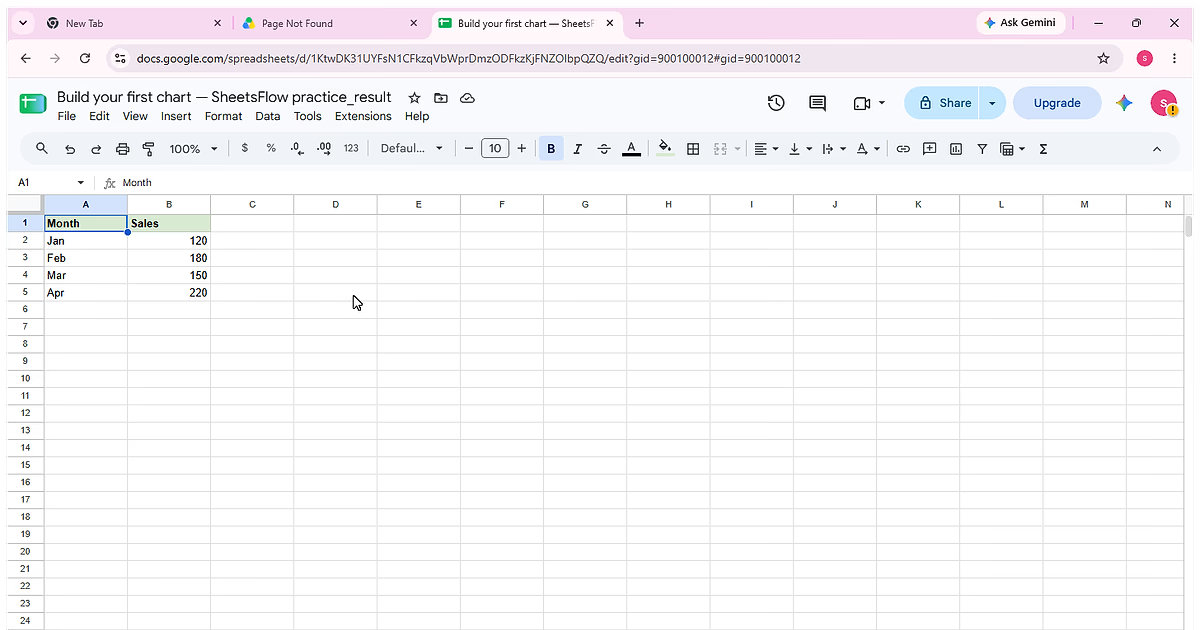
Turn the sample table (Month, Sales) into a chart whose categories and values can be checked directly against the visible source cells.
8 min readRead guide ↗
Bite-sized guides for real spreadsheet problems.
Turn the sample table (Month, Sales) into a chart whose categories and values can be checked directly against the visible source cells.
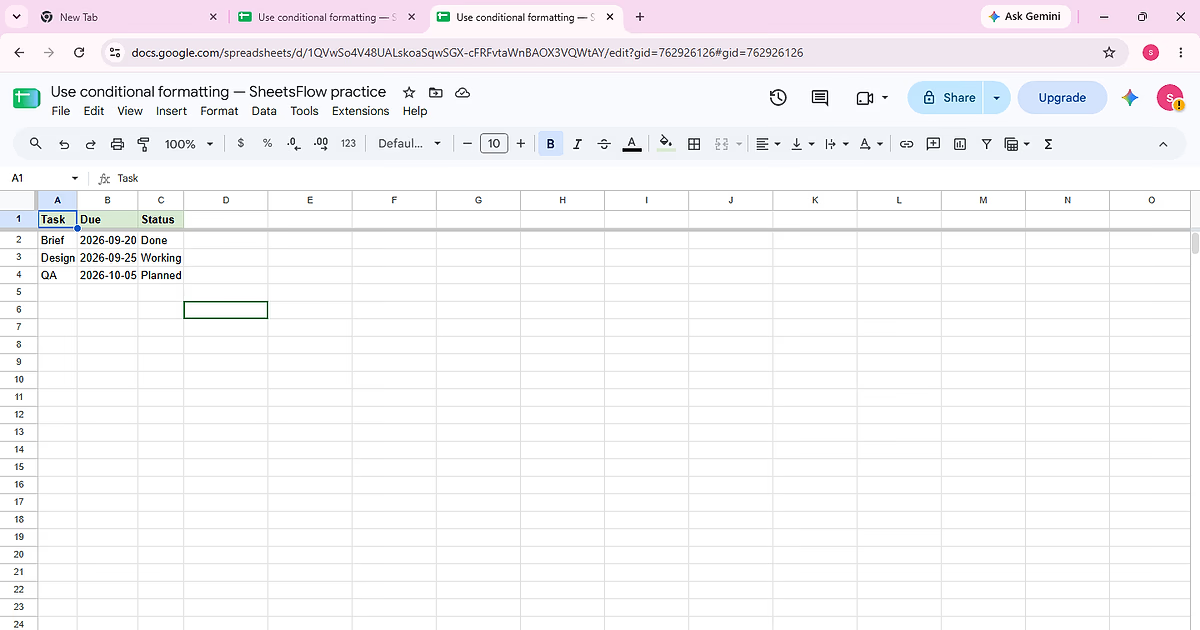
Complete “Use conditional formatting” using the visible Task, Due, Status, Expected match sample so each action and the final state can be checked against the source data.
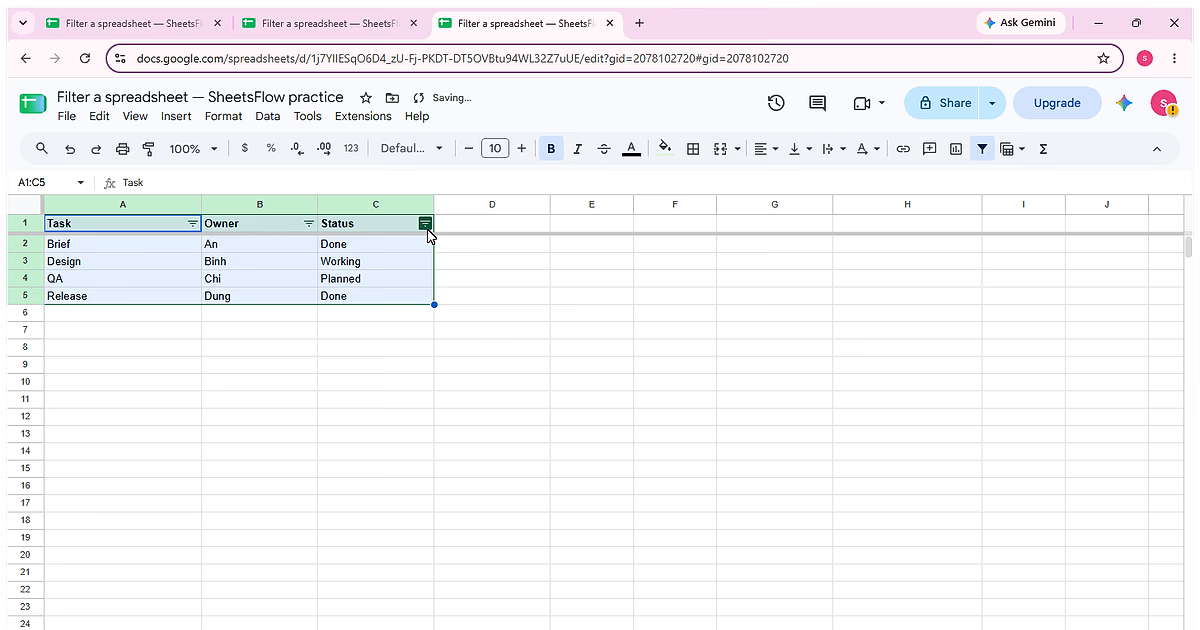
Complete “Filter a spreadsheet” using the visible Task, Owner, Status sample so each action and the final state can be checked against the source data.
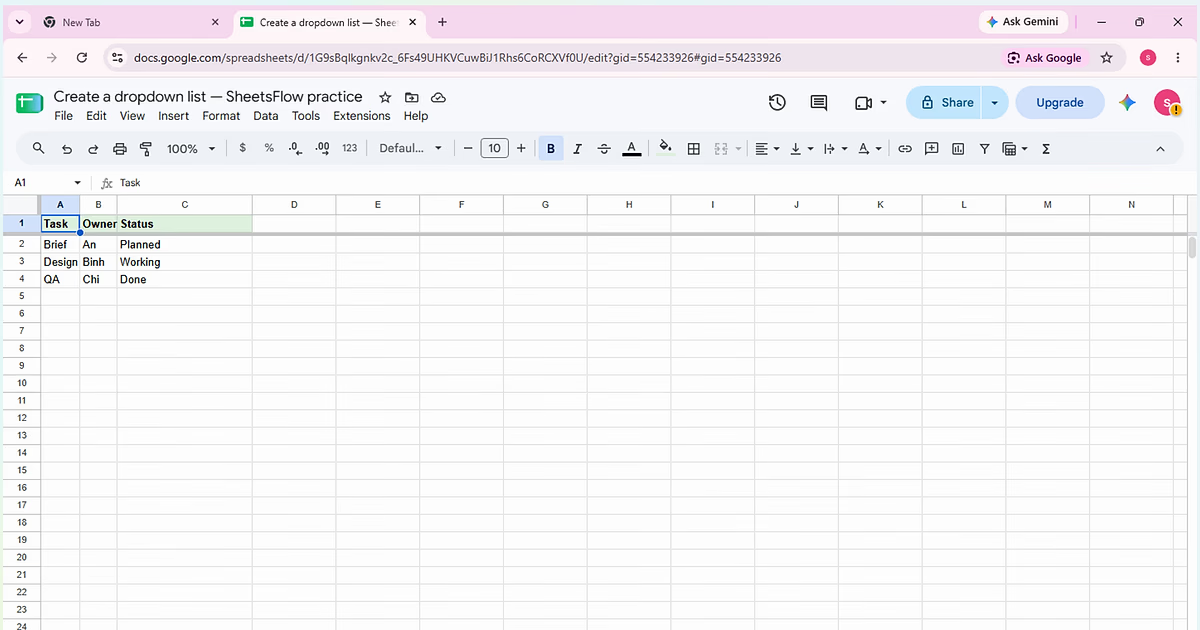
Create a controlled status dropdown for C2:C4 so task states stay consistent.
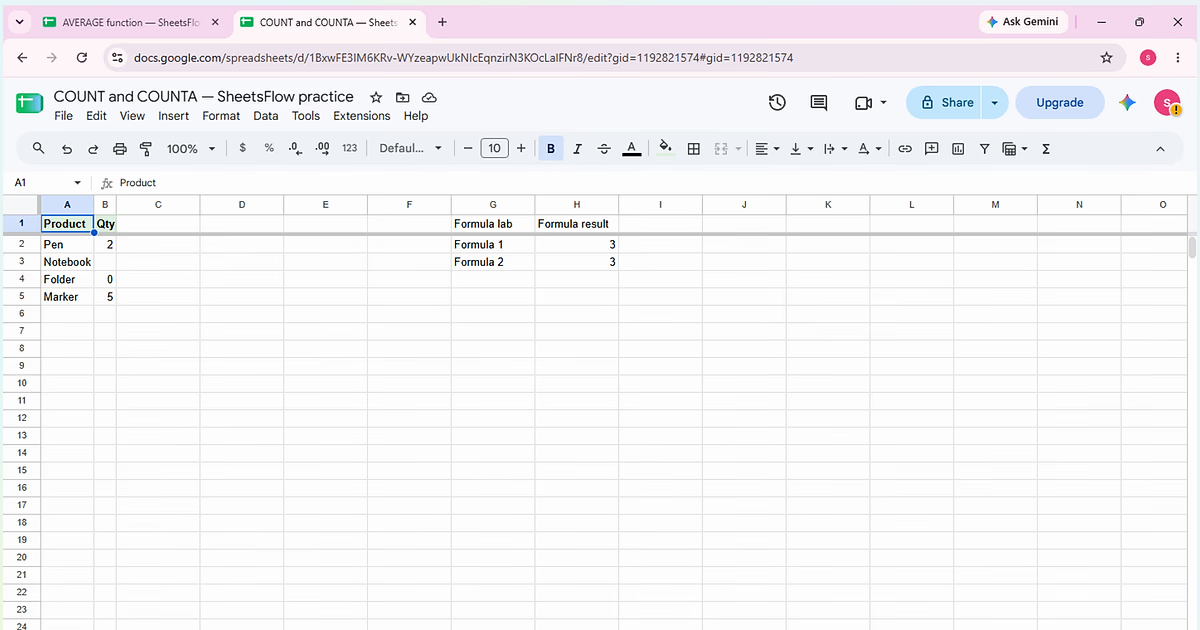
Compare COUNT and COUNTA on Qty values 2, blank, 0 and 5.
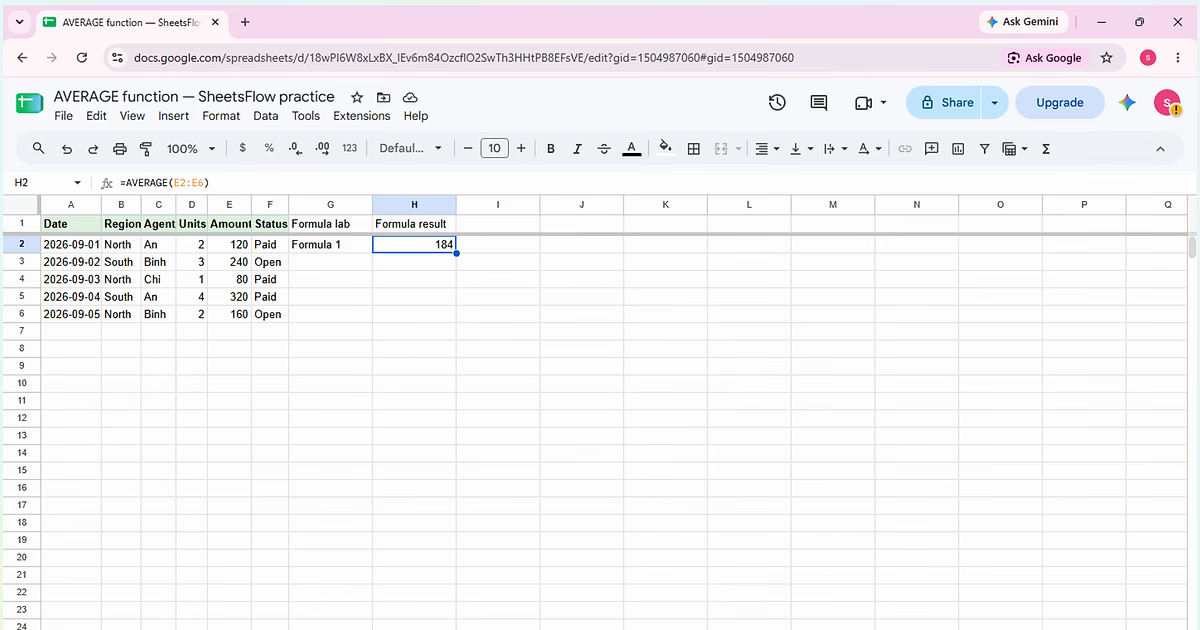
Calculate the mean Amount of the five orders and return 184.
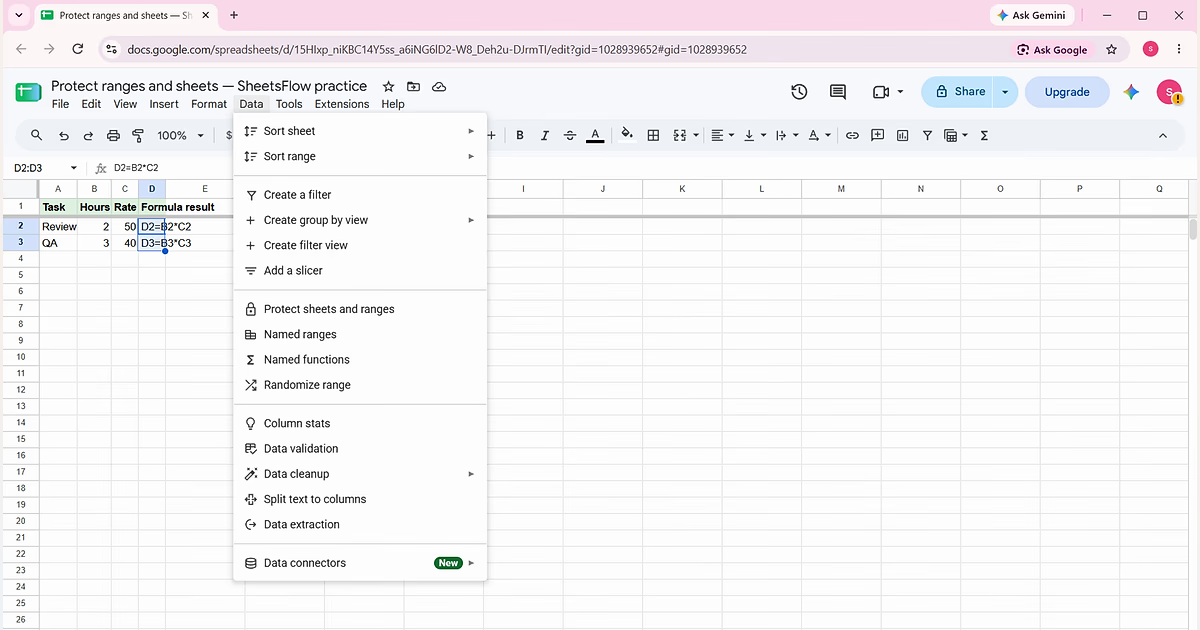
Protect a formula range so collaborators can update inputs without accidentally overwriting calculated costs.
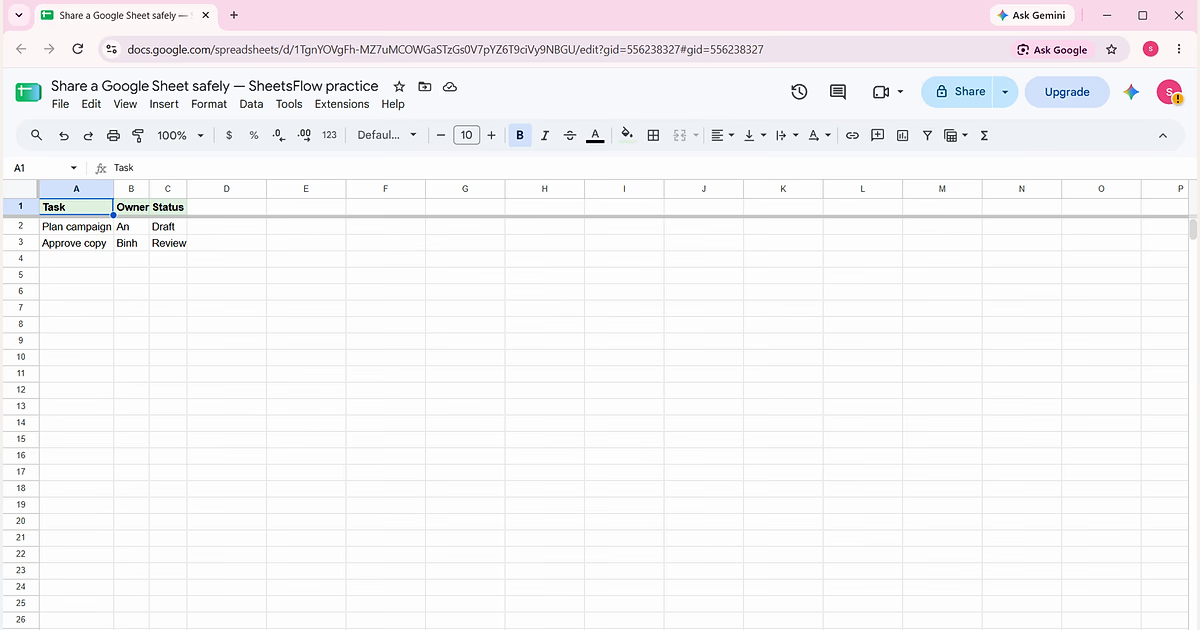
Share a Google Sheet with specific people and understand link access without accidentally making a working file public.
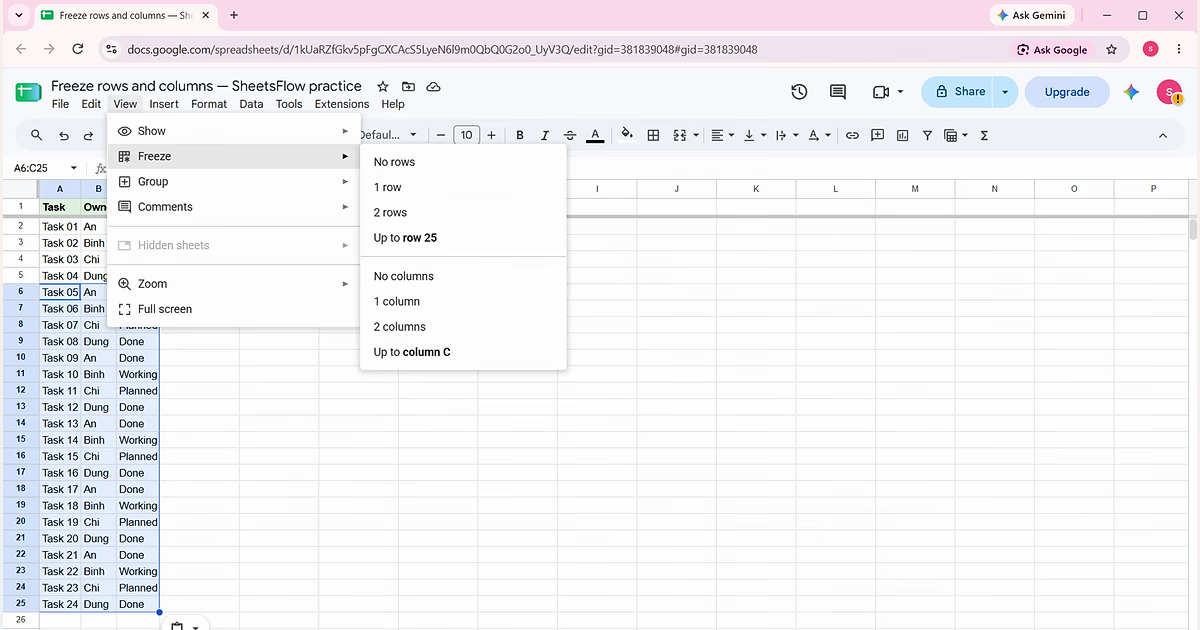
Keep headers and key labels visible while you scroll by freezing rows and columns in Google Sheets.
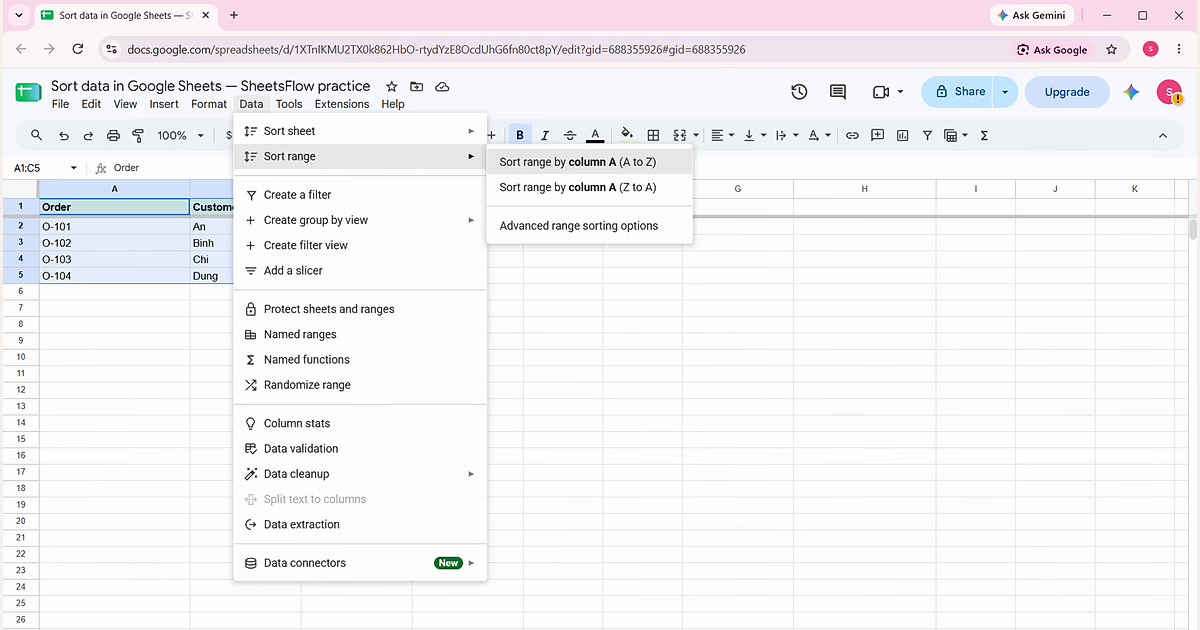
Sort an order table without separating customers from their orders.
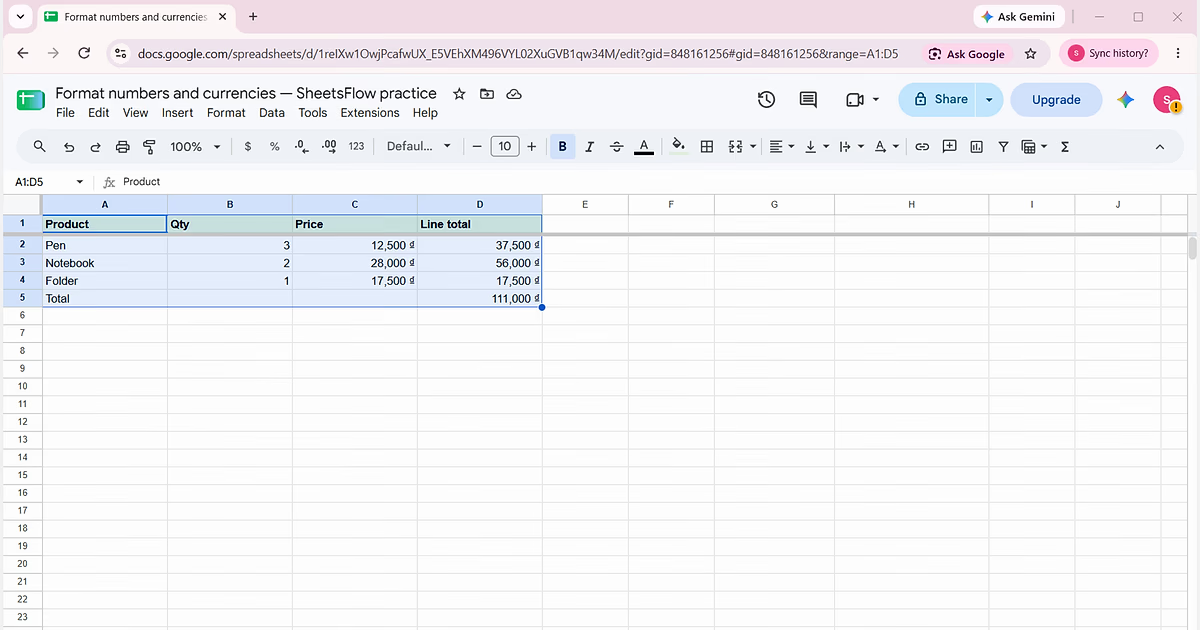
Format real numbers as Vietnamese đồng, calculate item totals and keep the underlying values numeric.
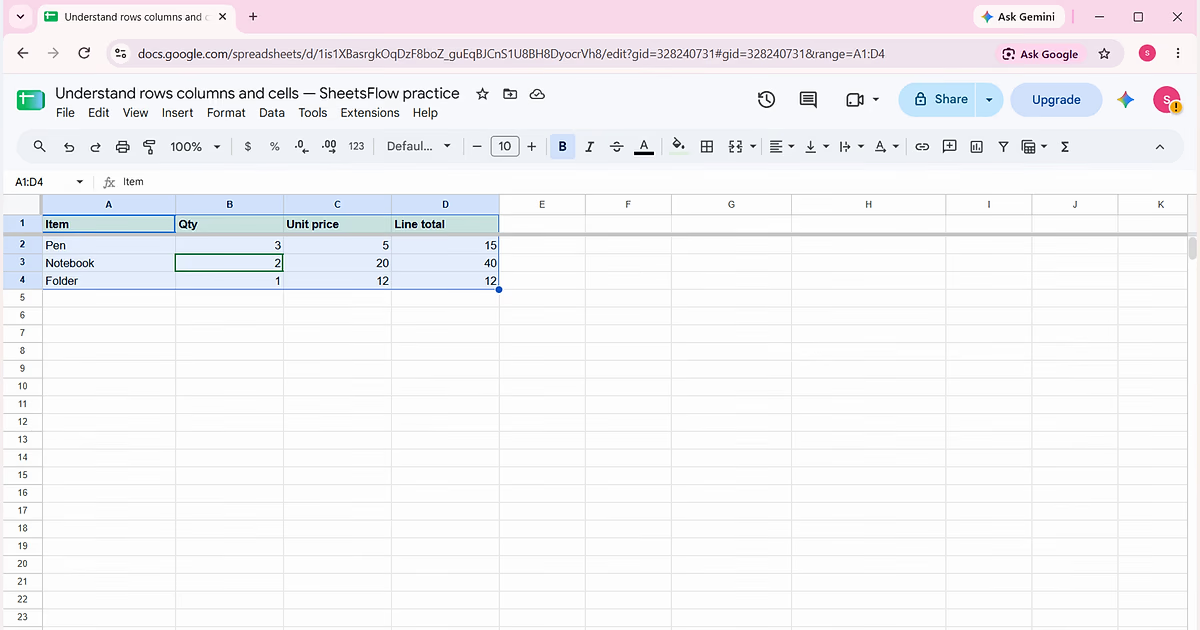
Learn how to read Google Sheets cell addresses, select ranges and calculate line totals with a four-row practice table.
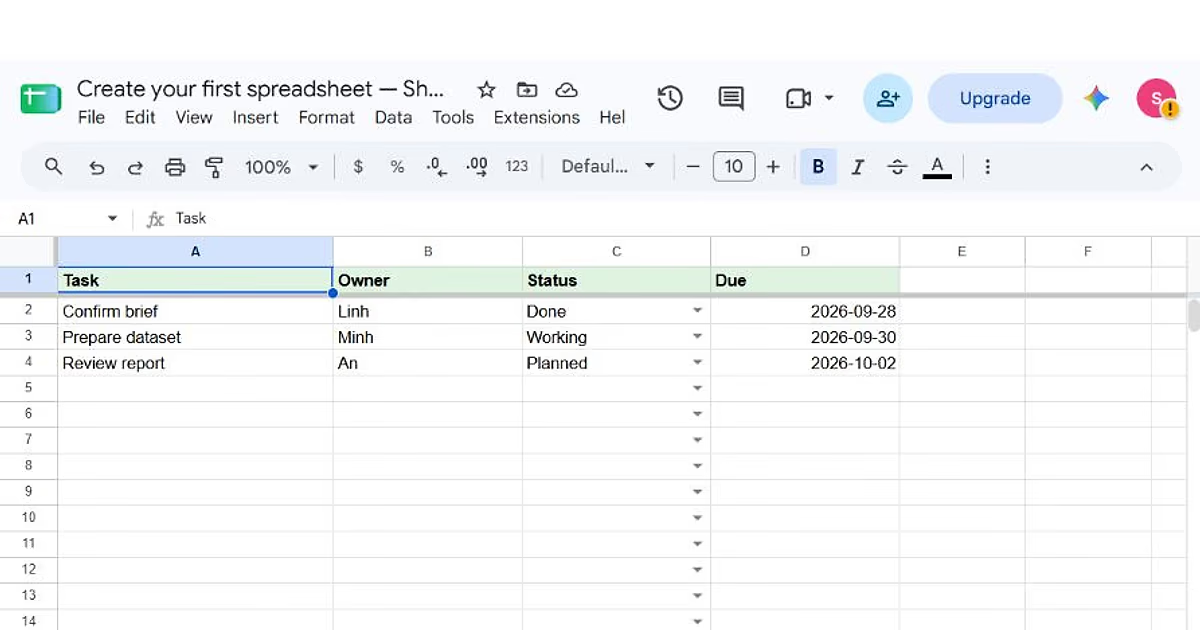
Build a real four-column task tracker with a frozen header, status dropdowns, valid due dates and a matching practice workbook.
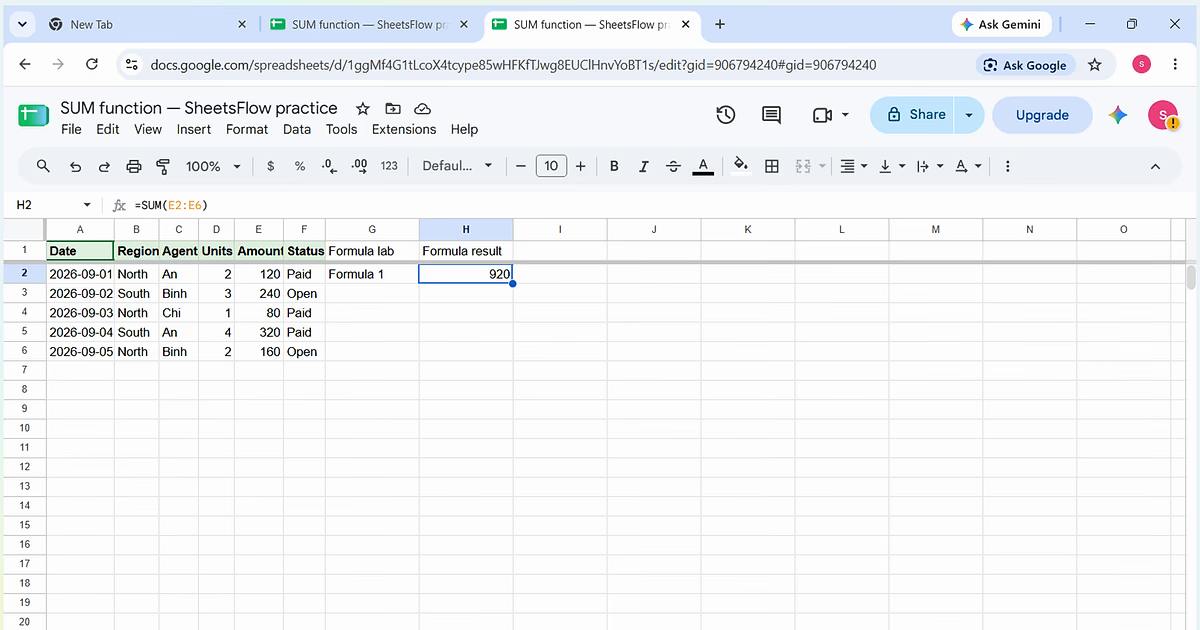
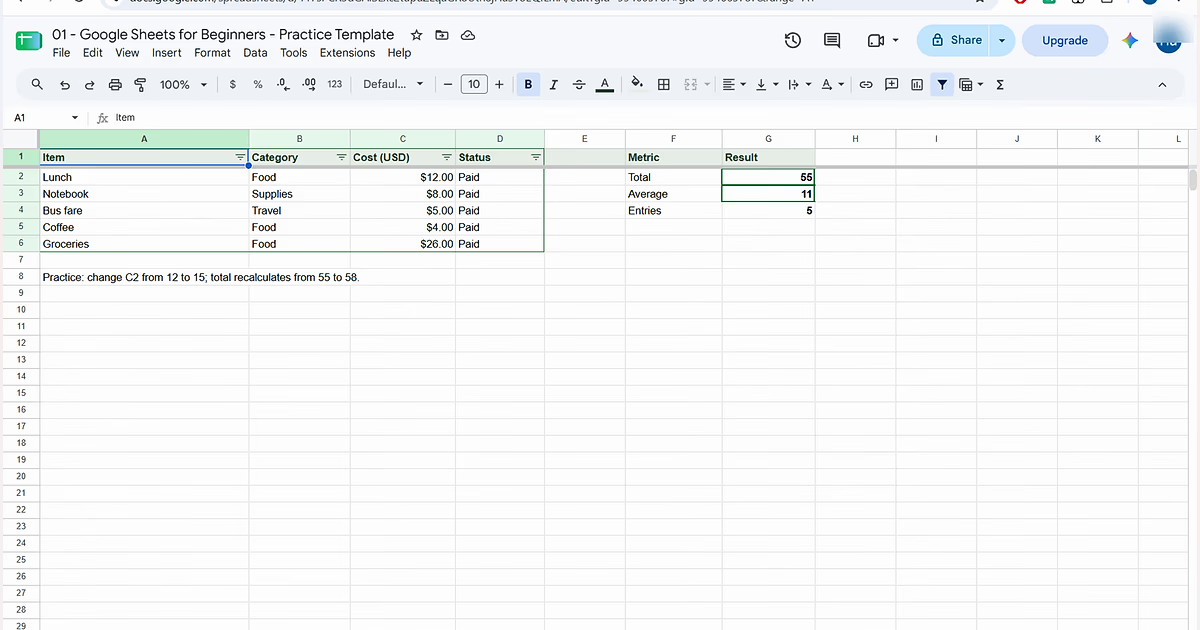
Create your first spreadsheet with a real expense tracker. Learn cells, formatting, filters, sharing, SUM, AVERAGE and COUNT with verified screenshots and results.